Centipawn Loss Distribution
I'm always interested in values and stats calculated by engines that can give an overview of a chess game.One very common indicator to give an overview of the quality of a game is the average centipawn loss (ACPL). This is the average number of centipawns a player has lost during a game. So an ACPL of 50 for White means that on average every time White made a move, the evaluation dropped by 0.5 pawns.
Having only one number trying to describe the whole game obviously leads to many situations where the number can be quite misleading. For example, an ACPL of 50 for White could mean that White made inaccuracies on almost every move or that they played well for most of the game but made one big blunder.
So I thought about different ways of looking at centipawn loss (CPL) and thought that it might be interesting to look at the distribution of the CPL.
Note that there is some criticism about centipawn loss since it doesn't differentiate from going from a 0.0 position to a -2 position or from +7 to +5. The second scenario obviously isn't a mistake, but in both cases, there is a CPL of 200. So many chess websites started using accuracy instead of ACPL, but I decided to keep the CPL for this post to make things a bit easier to compare. The same thing can also be done for accuracy and I might look more into this in the future.
CPL Distribution for a single game
The ACPL can be especially misleading when the game is drawn since both sides will have roughly the same ACPL. This is where the distribution of the CPL at every move might be more insightful.
As an example, I chose the game Vidit-Caruana, 2024 from the ongoing Candidates tournament:
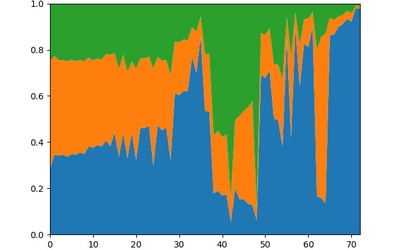
Vidit slowly gained a big advantage but missed one resource for Caruana and had to settle for a draw. This is reflected well in the CPL distribution:
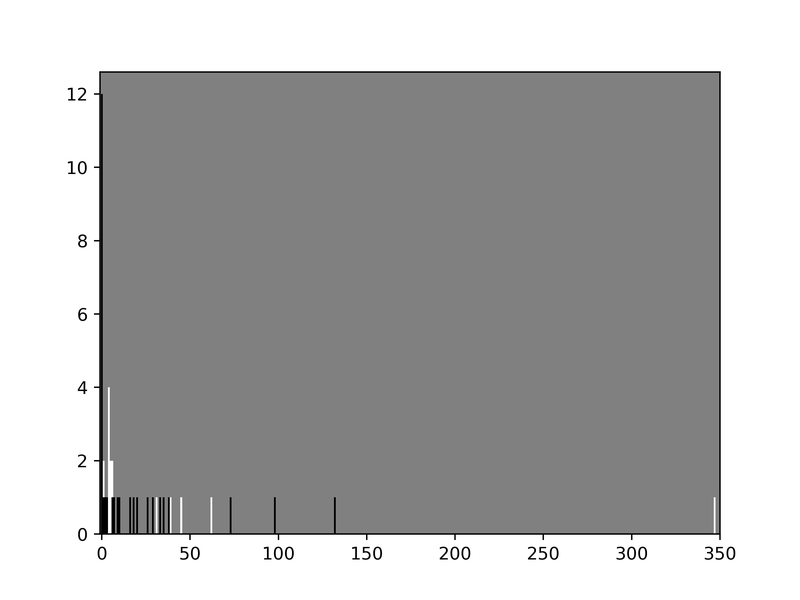 On the x-axis is the CPL per move and on the y-axis is the number of moves played that had this CPL.
Caruana as Black has made multiple inaccuracies but Vidit made one blunder.
But one might argue that this graph doesn't add much additional insight since one can already see this in the normal game graph on Lichess (or in a WDL graph):
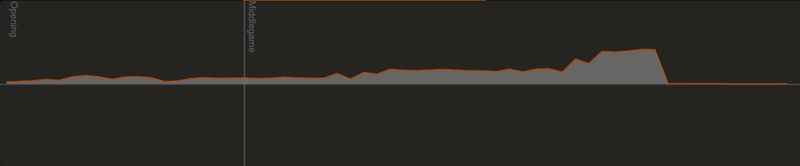 I would also agree with this however, I think that the CPL distribution becomes much more interesting when one looks at multiple games.
CPL Distribution for many games of a player
Looking at the CPL distribution of multiple games by the same player might give some insights about their play. In particular, it shows if a player tends to blunder quite often or if they make fewer blunders but more small mistakes compared to other players at their rating.
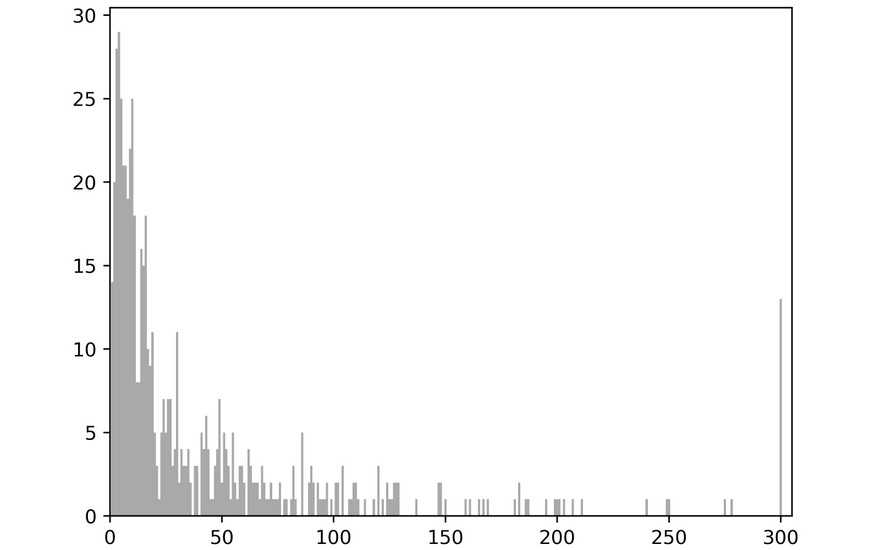
In order to look at the CPL distribution for multiple games, I analysed 20 of my most recent OTB games. This is the graph I got: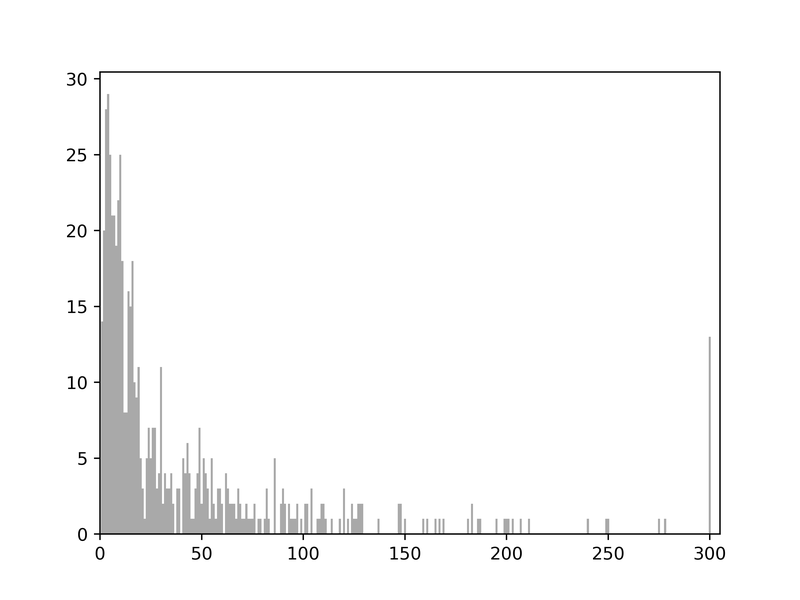 Note that I set the maximum to 300 to reduce the spread of the graph. I also filtered out all moves with a CPL of 0 since they are so common that it makes the graph difficult to read.
It's interesting to see that most moves have a CPL below 30 and after that, the distribution drops quickly. However, the number of moves from a CPL between 30 and 130 stays roughly the same. This means that I made about as many moves with a CPL of 30 and a CPL of 130.
There are many moves with a CPL of more than 200 and also some moves with a CPL of more than 300. So these games included some big mistakes on my side. Comparing this with other players of a similar rating might show if I need to work on reducing my blunders.
It would be very interesting to compare OTB games over multiple years with such graphs and see how the distribution changes.
Future Plans
I think that there is a lot that can be done with the CPL distribution.
As mentioned above, it would certainly be interesting to look at how this distribution changes for one player over time. However, I think it might be even more interesting when it's used to compare different players. It will probably show whether one player is more blunder-prone than another and might show even more interesting things.
Looking at the distribution from the Vidit-Caruana game, it's also intriguing that Vidit had many more moves with a small CPL that is still greater than 0. It might hint that one player is playing a bit more adventurous moves while still playing accurately.
The only problem is that analysing many games takes a lot of time and computing resources. So any support on Substack or Patreon would be hugely appreciated.
I'll certainly continue to look into these graphs and post future posts about them.
Until then, I would love to hear what you think about the CPL distribution.
More blog posts by jk_182
The Candidates in 13 Graphs
Looking at stats from the 2024 Candidates tournament
Calculating the Sharpness of Different Players
How well does the sharpness score agree with the human intuition about sharpness?
Evaluating Sharpness using LC0's WDL
Can engines tell how sharp a position is?